
U.S. Large Stocks Dominate
Investing this past decade has been defined by a long bull market rising from the ashes of the Great Financial Crisis of 2007-2008. The current bull market—defined as a generally increasing stock market without a 20% decline—is now almost 11 years old, the longest in U.S. history.
Like other bull markets, the strength of equity returns has been driven by increasing corporate earnings. Companies in the S&P 500 increased earnings per share by around 190% over the decade.
But this market has also been propelled by investors’ willingness to pay higher and higher prices for the same earnings stream. The forward-looking Price to Earnings (P/E) ratio for S&P 500 stocks has increased from 14 to 18 over the decade. This change alone accounts for about a 2 ½% annualized gain over the decade (approximately 20% of the overall increase).
With the 2010’s ending, it’s a good time to look back on what has transpired. Which asset classes outperformed, who underperformed, and how does this compare to history.
Asset Class Returns (2010-2019)
U.S. stocks outperformed the broad international stock market. Within the U.S. markets, large-cap stocks bested small-cap; and within large-cap, technology companies dominated.
The past decade’s returns were largely driven by the performance of a small number of large technology companies.
International stocks, both developed markets (EAFE) and emerging markets, were a significant drag on a diversified portfolio. For emerging markets specifically, investors did not get paid well for investing in this higher risk asset class.
Annualized Total Return by Asset Class (2010 to 2019)
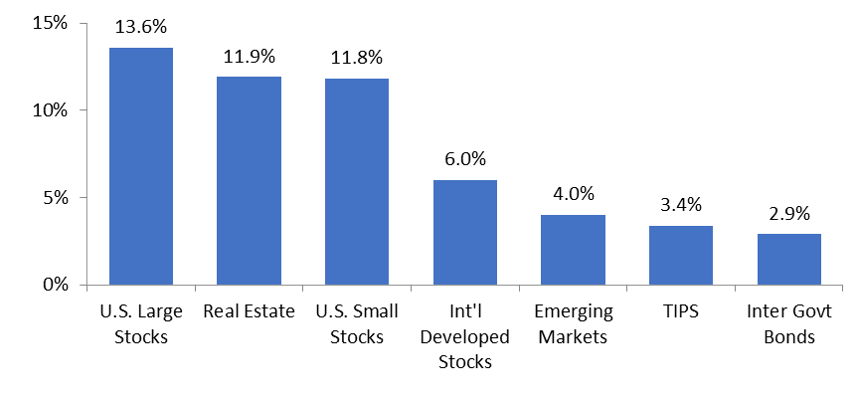
The following indexes are used to represent specific asset class performance: Intermediate government bonds (BloomBarc Govt Intermediate Bond Index), Int’l developed market stocks (MSCI EAFE Index), TIPS (BloomBarc US Trsy Inflat Prtcd Idx), Real Estate (MSCI US REIT Index), Emerging Market stocks (MSCI Emerging Market (gross) index). Source: Vanguard.com, Morningstar.com, MSCI.com
On the fixed income side, longer term bond yields continued to shrink over the decade. The 10-year Treasury bond ended December at 1.9%, halving it’s 3.8% yield at the start of the decade.
It’s a different story on the short-term side. 90-day T-bills started the decade with a near zero (<0.1%) yield and remained there for most of the decade—not raising above 1% until mid-2017. Yields peaking at under 2.5% in early 2019 before closing out the decade at around 1.6%.
Being an investor in intermediate-term government bonds over the decade provided some increase in principle value (as yield fell) but small coupon payments resulting in an annualized nominal return under 3%.
The real return from TIPs was a bit better, but still only slightly above 1% annually after accounting for inflation.
Real Estate Investment Trusts (REIT) continue to be a bright spot for investors, producing equity-like returns.
Returns Compared to Prior Decade
Returns from this past decade (2010s) are markedly different from the prior decade (2000s) when many equity investors lost money over the 10-year period—what has been called the “lost decade” for investing.
Annualized Total Return by Asset Class (2000-2009)
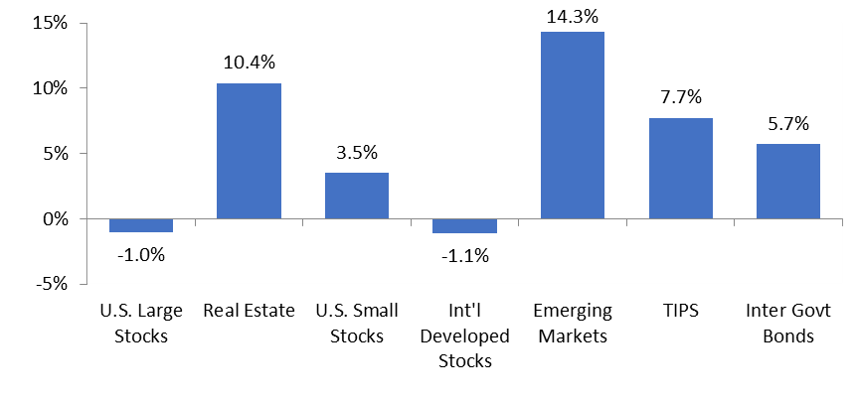
The following indexes are used to represent specific asset class performance: Intermediate government bonds (BarCap Govt Intermediate Bond Index), Int’l developed markets stocks (MSCI EAFE Index), TIPS (BarCap US Govt Inflation Linked Bond Index), Real Estate (MSCI US REIT Index), Emerging Market stocks (Wilshire Emerging Markets Index). Index performance data from Morningstar
During the millennium’s first decade, large U.S. stocks (S&P 500) and international developed market stocks lost money. Large U.S. stocks reversed course, providing outstanding returns over the past 10 years, whereas international stocks continued to struggle (although they did manage mid-single digit returns).
REITs are the consistent winner over the past two decades—putting up some of the highest returns over both periods.
Historical Perspective
Taking a step back even further, let’s compare recent returns to long-term average returns by asset class. For this view we turn to the University of Chicago’s Center for Research in Security Prices to get historical returns going back to 1926.
Annualized Returns 1926 to 2018
| Inflation |
2.9% |
| Gov’t Bonds |
5.2% |
| International Stocks |
8.0% |
| Large U.S. Stocks |
10.0% |
| Small U.S. Stocks* |
11.8% |
Source: Center for Research in Security Prices (CRSP). *Source = Morningstar’s Ibbotson SBBI (2019).
With this long-term perspective, you see the expected relationship between risk and return. Higher risk investments return more than lower risk investments as demonstrated by stocks delivering higher returns than bonds (and small-cap stocks outperforming large-cap stocks).
International stocks provide an interesting data point. As shown in the table above, international stocks fall between bonds and large-cap U.S. stocks in total return. Which may make one question the wisdom of holding any international stocks if they offer a lower total return with a similar risk profile to U.S. stocks.
In addition, international stocks have significantly lagged U.S. stocks over the past 10 years. Yet international stocks account for approximately half the total market capitalization of all public companies worldwide, so only holding U.S. equities would dramatically reduce your exposure to the overall global stock market.
Furthermore, total return from international equities is more inline with U.S. returns if you shorten the lookback to the past 50-70 years (post-WW II).
Diversification at work during the “lost decade”
Over the past 10 years, some of the highest returns were realized just by investing in the S&P 500 index—one of the most widely known and invested in indices.
One might wonder why bother with any other investments, if the easiest and cheapest index fund available, can deliver the highest return?
The short answer is because this past decade was the exception, not the rule. The prior decade—the 2000s—provides the perfect counterpoint. Broad U.S. market indices like the S&P 500 lost money over the 10-year period—ended the decade with less value than they started it with (i.e., negative return over the decade).
Yet investors with a diversified portfolio came out of the “lost decade” with solid annualized returns—potentially increasing their wealth by over 80%.
It was called the “lost decade” for investors in the United States because investors in the stock market lost money over the 10 year period January 1, 2000 to December 31, 2009. The three major U.S. stock market indexes (Dow Jones Industrial Average, S&P 500, and NASDAQ) were all lower at the end of 2009 than at the start of 2000 – negative returns over an entire decade.
Let’s compare three different potential investment portfolio options from the lost decade:
- 100% invested in S&P 500 Index (the big “winner” during the 2010s decade)
- 60% invested in S&P500 Index and 40% in an Intermediate Government Bond Index (a simple balanced portfolio)
- A “fully” diversified portfolio (see below for details)
Diversified Investor Made Solid Returns — Annualized Returns (2000-2009)
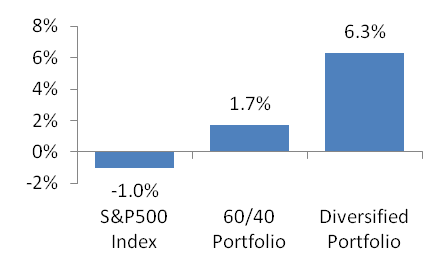
Source: Index performance data from Morningstar; analysis by Denny Park Investments LLC
As the chart above demonstrates, during the 00s, a diversified portfolio provided a significantly higher return than a portfolio only invested in large-cap U.S. stocks (e.g., the S&P 500 Index).
Providing a vivid example of why investors should craft a diversified portfolio allowing them to benefit regardless of which asset classes enjoys superior returns over the next decade.
Our theoretical Diversified Portfolio is based on a Balanced model asset allocation (rebalanced annually) consisting of: 42% equities (12% S&P 500 Index, 5% Russell 1000 Value Index, 4% Russell 2000 Index, 3% Russell 2000 Value Index, 7% MSCI EAFE Index, 4% MSCI EAFE Value Index, 4% Wilshire Global Ex US Small-Cap Index, 3% Wilshire Emerging Markets Index), 30% fixed income (11% BarCap 1-3 Yr Government Bond Index, 8% BarCap Govt Intermediate Bond Index, 11% BarCap US Govt Inflation Linked Bond Index), 24% alternatives (12% MSCI US REIT Index, 7% Dow Jones UBS Commodity Index, 5% Credit Suisse Tremont Event Driven Index), and 4% cash (Citi Treasury Bill 1 Month Index). This is a model asset allocation. You cannot invest directly in an index.