The Shiller PE helps you assess if the U.S. stock market is fairly valued. The S&P 500 index stands at around 5,220 having already increased by nearly 10% this year.
So, is the market overvalued?
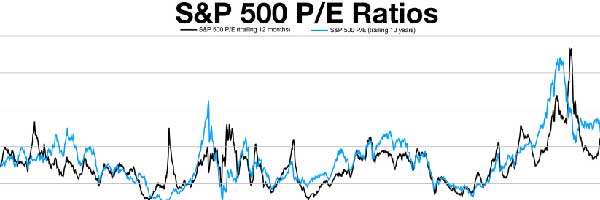
Over the past 20 years, the Shiller PE has averaged a reading of about 26. Today, the ratio stands at nearly 36. Indicating that the market is trading at a significant premium to historical levels.
And the last 20 years have been historically expensive compared to prior periods. According to one source, the all-time average Shiller PE is around 17.
What is the Shiller PE (or Price to Earnings) Ratio
The Shiller PE, also known as the cyclically adjusted price-to-earnings ratio (CAPE), was developed by economist Robert Shiller. It’s a valuation measure for the stock market that takes into account inflation-adjusted earnings over the past 10 years.
The formula for calculating the Shiller PE is:
Shiller PE = Current Price / Average of 10 years of Inflation-adjusted Earnings
This metric is considered useful for assessing whether the stock market is overvalued or undervalued compared to historical norms. A high CAPE ratio may suggest that the market is overvalued and could be due for a correction. While a low ratio may indicate that stocks are undervalued. However, like any valuation metric, it has its limitations and should be used in conjunction with other indicators and analysis.
How is the Shiller PE different from the standard P/E ratio?
The standard price-to-earnings (PE) ratio is a simple ratio that compares the current market price of a stock to its earnings per share (EPS) over a specific time period. Usually the trailing twelve months (TTM) or the estimated forward twelve months (forward PE).
The formula for calculating the standard PE ratio is:
PE Ratio = Current Market Price per Share / Earnings per Share (EPS)
The PE ratio is straightforward and easy to calculate, but it has some limitations. For example, it doesn’t account for fluctuations in earnings over time or changes in the business cycle.
On the other hand, the Shiller PE, or cyclically adjusted price-to-earnings (CAPE) ratio, addresses some of these limitations by using the average of inflation-adjusted earnings over a longer period, typically the past 10 years. By using a longer time frame, the Shiller PE smoothens out the effects of short-term fluctuations in earnings and provides a more stable measure of valuation.
While both ratios provide insights into the valuation of stocks, the standard PE ratio is based on shorter-term earnings data, while the Shiller PE incorporates a longer-term perspective by using inflation-adjusted earnings over a 10-year period.
Predicting Future Returns
The Shiller PE has been studied extensively to assess its predictive power for future stock market returns. While it’s widely used and respected as a valuation measure, its ability to predict future returns is subject to debate and depends on various factors.
Historically, high CAPE ratios have often been associated with lower future returns over the subsequent decade, and vice versa.
This relationship suggests that when stocks are relatively expensive based on the Shiller PE, future returns tend to be lower, and when stocks are relatively cheap, future returns tend to be higher.
However, it’s important to note that the relationship is not perfect, and there have been periods where the Shiller PE remained high for extended periods without an immediate market correction.
One notable study by Robert Shiller himself, along with John Campbell and Yueran Ma, found that the Shiller PE ratio has some ability to predict long-term (10-year) stock market returns, particularly in developed markets like the United States. However, they also noted that the relationship is not precise and can be influenced by other factors such as changes in interest rates, investor sentiment, and economic conditions.
Overall, while the Shiller PE ratio can provide valuable insights into the valuation of the stock market and may offer some indication of future returns over the long term, investors should not rely solely on this metric for making investment decisions. It’s essential to consider other factors and conduct comprehensive analysis before making investment choices.
SHOULD I INVEST INTERNATIONALLY?
How to Use CAPE to Inform Investments
Investors can use the cyclically adjusted price-to-earnings (CAPE) ratio, also known as the Shiller PE ratio, as a tool to guide their investment decisions in several ways:
Valuation Assessment: The CAPE ratio provides investors with a measure of how expensive or cheap the stock market is relative to historical norms. When the CAPE ratio is high, it suggests that stocks are relatively expensive, and when it’s low, it suggests that stocks are relatively cheap. Investors can use this information to gauge whether the market is overvalued or undervalued compared to long-term averages.
Long-Term Investment Allocation: Investors with a long-term investment horizon, such as retirement planning or wealth accumulation, may adjust their asset allocation based on the CAPE ratio. When the CAPE ratio is high, they may consider reducing their exposure to stocks and increasing allocations to other asset classes like bonds or alternative investments. Conversely, when the CAPE ratio is low, they may increase their exposure to stocks.
Risk Management: High CAPE ratios can indicate elevated levels of market risk, as they suggest that future returns may be lower than average. Investors may use this information to manage their risk exposure by incorporating strategies such as diversification, hedging, or reducing leverage in their portfolios.
Expectation Setting: Understanding the CAPE ratio can help investors set realistic expectations for future investment returns. When the CAPE ratio is high, investors should anticipate lower-than-average returns over the long term, and vice versa. This can help prevent over-optimistic expectations and reduce the likelihood of making impulsive investment decisions.
It’s important to note that while the CAPE ratio can provide valuable insights into market valuation, it’s just one of many factors that investors should consider when making investment decisions. Additionally, the CAPE ratio has limitations and may not accurately predict short-term market movements or timing market corrections.
Criticism of CAPE
The Shiller PE ratio, despite its popularity and widespread use, is not without criticism. Some of the main criticisms include:
Mean Reversion Assumption: The Shiller PE ratio is based on the assumption that stock market valuations revert to their historical mean over time. Critics argue that this assumption may not always hold true, particularly in periods of structural economic change or shifts in investor behavior. Therefore, relying solely on mean reversion may lead to inaccurate predictions.
Earnings Smoothing: The Shiller PE ratio uses a 10-year average of inflation-adjusted earnings to smooth out short-term fluctuations. However, this smoothing process may obscure important changes in earnings trends or business cycles. Critics argue that using a longer time frame may not capture the most relevant earnings data for assessing current market conditions.
Changes in Accounting Standards: The CAPE ratio relies on reported earnings, which can be influenced by changes in accounting standards or one-time adjustments. Critics argue that these accounting changes can distort the earnings data used in the calculation of the Shiller PE ratio, potentially leading to misleading valuation assessments.
Globalization and Technology: The Shiller PE ratio was developed based on historical data from the U.S. stock market. Critics argue that in today’s globalized economy, with rapid technological advancements and changing industry dynamics, historical valuation metrics may not accurately reflect current market conditions or future prospects.
Interest Rates and Inflation: The Shiller PE ratio does not explicitly account for changes in interest rates or inflation expectations. These can have a significant impact on stock market valuations. Critics argue that ignoring these factors may limit the predictive power of the Shiller PE ratio, particularly in environments where interest rates are low or inflation is elevated.
Despite these criticisms, the Shiller PE ratio remains a widely used and respected valuation metric. Due to its long-term perspective and ability to capture underlying trends in stock market valuations. However, investors should be aware of its limitations and use it in conjunction with other tools to make well-informed investment decisions.
Who is Shiller?
The Shiller PE is named after the economist Robert Shiller.
Robert Shiller is a Nobel laureate in economics and a professor at Yale University. He is widely known for his research on financial markets, particularly in the field of behavioral finance and the study of asset price bubbles. Shiller introduced the concept of the CAPE ratio in his book “Irrational Exuberance” published in 2000. He highlights the importance of adjusting traditional price-to-earnings ratios for cyclicality in earnings.
Since then, the Shiller PE ratio has become a popular metric for assessing stock market valuations.
How to Track the Shiller PE
There are several websites that track the Shiller PE ratio, also known as the cyclically adjusted price-to-earnings (CAPE) ratio.
Some of the popular websites where you can find the Shiller PE ratio include:
Yale University’s Online Data: Robert Shiller, the creator of the CAPE ratio, provides historical data on his website. Yale University – Irrational Exuberance. This data includes the historical values of the Shiller PE ratio for the U.S. stock market.
Multpl.com: Multpl.com provides current and historical data on the Shiller PE ratio for the S&P 500 index. The website also offers interactive charts and additional information related to stock market valuation metrics.
Shiller PE Ratio by Current Market Valuation: This website offers historical data on the Shiller PE ratio. Plus, other market valuation metrics such as the Buffett Indicator and the Tobin’s Q ratio. You can find the Shiller PE ratio for various global stock markets on this site. Shiller PE Ratio by Current Market Valuation
GuruFocus: GuruFocus provides current and historical data on the Shiller PE ratio for multiple stock indices. The website also offers analysis tools and articles related to market valuation.
These websites offer valuable resources for investors and analysts interested in tracking the CAPE ratio to assess stock market valuations.