What has the typical family net worth growth been over time in the United States? Are you accumulating assets faster or slower than your age group peers? And what has the impact of recent inflation been on household net worth?
The Federal Reserve Board’s Survey of Consumer Finances (SCF) is conducted every three years. It provides us with the data needed to answer these questions. The survey helps us understand how wealth has changed over time. And paints a picture of the net worth lifecycle of the typical U.S. household.
This is the fourth part of our series on financial voyeurism. We delve into how household net worth has changed over time. Plus, we explore the dramatic difference between nominal and real (i.e., inflation-adjusted) wealth.
See our prior articles on income and other aspects of net worth:
1 – EXPLORING HOUSEHOLD INCOME
2 – NET WORTH BY AGE IN THE U.S.
3 – DISTRIBUTION OF HOUSEHOLD NET WORTH IN THE U.S.
Survey of Consumer Finances
Over the past three years, household wealth in the United States has experienced a dramatic transformation. This change is revealed by the Federal Reserve’s Survey of Consumer Finances (SCF).
This comprehensive examination of the financial well-being of American households provides valuable insights into the unprecedented growth in net worth.
In this article, we analyze wealth growth by age cohort and delve into the substantial impact of inflation. Accounting for inflation, allows us to differentiate between nominal and real growth in assets.
The Survey of Consumer Finances, conducted triennially by the Federal Reserve, is a critical tool. It helps us understand the financial health of households across the nation. By collecting data on income, assets, debts, and other financial aspects, the SCF enables the public to gain a comprehensive view of the economic well-being of Americans.
Dramatic Household Net Worth Growth
According to the latest data from the Federal Reserve’s SCF, household net worth in the United States has experienced a remarkable surge over the past three years.
Sources: Federal Reserve, 2023 Survey of Consumer Finances.
The median net worth, which represents the middle point when all households are ranked by their net worth, has seen substantial growth. This surge can be attributed to various economic factors, including a robust stock market, rising real estate values, and increased savings.
Wealth by Age Cohort
Examining the distribution of wealth by age cohort provides a nuanced perspective on the transformative growth in net worth. Different age groups experience unique financial challenges and opportunities, influencing their overall wealth accumulation.
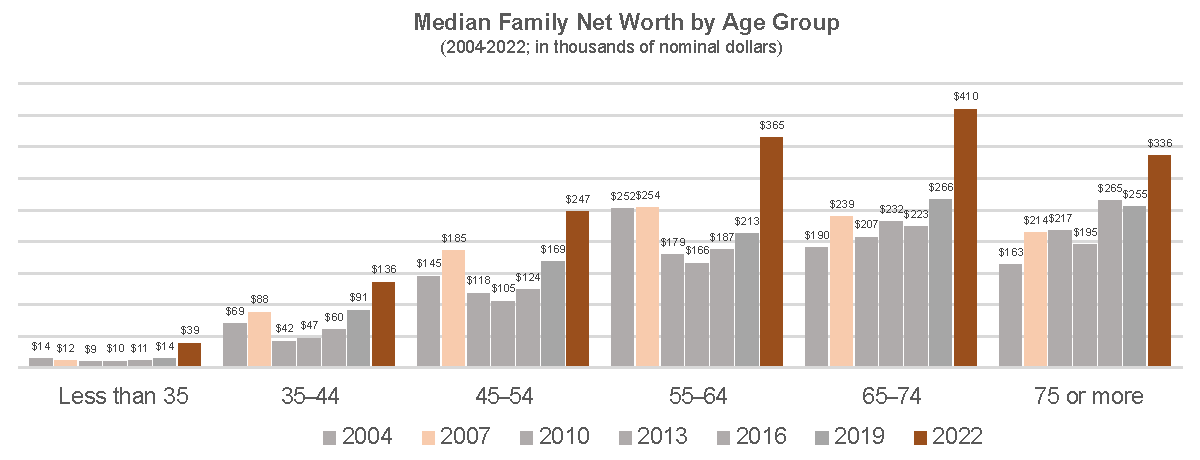 Sources: Federal Reserve, 2023 Survey of Consumer Finances.
Younger Households (Under 35): Typically facing challenges such as student loan debt and lower income. These younger households have seen modest growth in net worth on a dollar basic (~$25,000). But very robust net worth growth on a percentage basis (~175%). The recovery from the economic impacts of the COVID-19 pandemic has played a role in boosting the financial well-being of this cohort.
Middle-Aged Households (35-54): This age group has witnessed substantial growth. Benefiting from increased home values, expanded investment portfolios, and career advancements. These two age cohorts finally saw their nominal net worth recover from the 2008 financial crisis. For the 45-54 age group, it has taken 15 years for the median net worth to eclipse the high point from 2007 (pre–Great Recession).
Pre-Retirement and Retirement Age (55-74): These older age groups have also experienced extremely large growth in net worth. On a dollar basis, growth of about $150,000 per household. Similar to middle-aged households, they benefited from increased home values and expanded investment portfolios. And for the 55-64 age group, they finally fully recovered from the Great Recession (on a nominal dollar basis).
Retirement Age and Beyond (75+): Even households in this group have seen positive trends in net worth. Interestingly, although this age group also saw substantial net worth growth, their median net worth has more of a steady growth when compared to younger cohorts.
The Impact of Inflation on Nominal and Real Growth
While the nominal growth in household net worth reflects the total increase in assets and financial holdings, it is essential to consider the impact of inflation.
Inflation erodes the purchasing power of money over time, affecting the real value of assets. Real growth accounts for inflation, providing a more accurate measure of the actual increase in wealth.
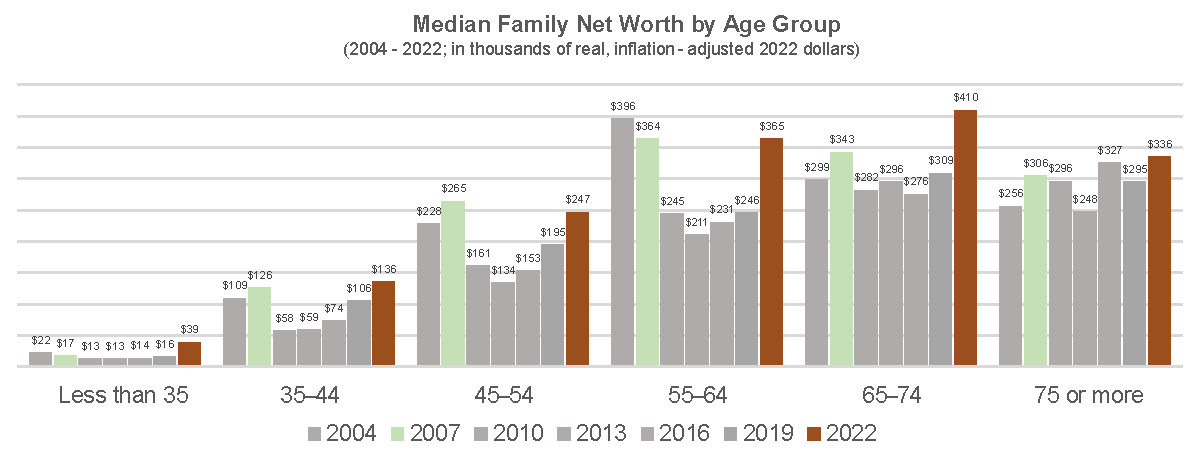 Sources: Federal Reserve, 2023 Survey of Consumer Finances.
Over the past few years, inflation has been a substantial factor influencing the difference between nominal and real growth in assets.
While nominal growth may appear impressive, adjusting for inflation is crucial to understanding the true purchasing power and value of the accumulated wealth.
Most notably, for the middle cohorts, the growth over the past three years has just returned their real median net worth to 2007 levels.
Tale to Two Crises
The Great Recession of 2008 and the more recent COVID-19 pandemic are two seismic events that profoundly shaped the economic landscape of the United States.
The Great Recession’s impact is shown in the decrease in net worth between the 2007 and 2010 surveys. Every age cohort demonstrated a loss in net worth. The most dramatically impacted being 35-64 age groups. Likely due to these age cohort’s net worth being most closely tied to housing values.
Whereas the COVID-19 pandemic saw dramatic increases in household net worth across the age spectrum.
One key aspect that differentiates these crises is their divergent impact on U.S. household net worth. While the Great Recession saw a significant decline in net worth, the COVID-19 pandemic witnessed an unexpected spike.
Housing Values:
Great Recession: The housing market played a central role in the Great Recession. The widespread collapse of the housing bubble led to a sharp decline in home values. Many households found themselves underwater on their mortgages, owing more than the current value of their homes. This resulted in a substantial reduction in overall net worth for numerous families who had invested heavily in real estate.
COVID-19 Pandemic: Unlike the Great Recession, the housing market during the COVID-19 pandemic exhibited resilience. Low-interest rates, increased demand for suburban homes due to remote work trends, and limited housing inventory contributed to a surge in home prices. Many homeowners experienced an increase in home equity, positively impacting their net worth.
Government Policy and Payments:
Great Recession: Government responses during the Great Recession were characterized by efforts to stabilize the financial system and stimulate economic activity. While measures such as the Troubled Asset Relief Program (TARP) aimed to stabilize the banking sector, direct financial assistance to households was limited.
COVID-19 Pandemic: The response to the COVID-19 pandemic featured unprecedented levels of government intervention. Stimulus packages, enhanced unemployment benefits, and direct payments to individuals were key components of efforts to mitigate economic fallout. These measures injected liquidity into households, helping to buoy consumer spending and contributing to an unexpected increase in net worth for many.
Stock Market Performance:
Great Recession: The Great Recession was characterized by a significant decline in the stock market. The bursting of the housing bubble and the ensuing financial crisis led to a sharp drop in stock prices. Retirement accounts and investment portfolios took a hit, contributing to the decrease in household net worth.
COVID-19 Pandemic: In contrast, the stock market response to the COVID-19 pandemic was marked by a swift recovery after an initial decline. Government stimulus, accommodative monetary policies, and the anticipation of economic reopening contributed to a robust rebound in stock prices.
Labor Market Dynamics:
Great Recession: The Great Recession witnessed widespread job losses, prolonged unemployment, and a slow recovery in the labor market. Many households faced financial hardship, and the accumulation of debt contributed to a decline in net worth.
COVID-19 Pandemic: Although the COVID-19 pandemic initially led to a sharp rise in unemployment, the labor market rebounded more quickly than during the Great Recession. Government support, coupled with the flexibility of remote work in certain industries, contributed to a faster recovery in employment levels and a subsequent boost in household income and net worth.
The contrasting impact on U.S. household net worth during the Great Recession and the COVID-19 pandemic underscores the complexity of economic crises and the importance of considering multiple factors.
The Great Recession, rooted in the housing market and financial sector, led to a decline in net worth for many Americans. In contrast, the COVID-19 pandemic, despite causing a brief economic downturn, resulted in an unexpected increase in net worth for a significant portion of the population.
Conclusion – Net Worth Growth
The dramatic growth in household net worth over the past three years, documented by the Federal Reserve’s Survey of Consumer Finances, reflects a complex interplay of economic factors.
From the recovery from the 2008 financial crisis to the impact of the COVID-19 pandemic and the influence of inflation, understanding the dynamics of wealth accumulation is crucial.
Examining wealth by age cohort provides a nuanced perspective on how different segments of the population contribute to this surge. As we celebrate the positive trends in household net worth, it is essential to remain vigilant, considering the long-term sustainability and inclusivity of this economic growth.