Financial curiosity often leads us to ponder how our finances compare to those of others. Are we accumulating assets faster or slower than our peers, and how does our household net worth measure up to the national average?
In this third part of our series on financial voyeurism, we delve into the intricacies of net worth and explore how the wealth of the typical American household stacks up against the national averages.
Part 1 – EXPLORING HOUSEHOLD INCOME
Part 2 – NET WORTH BY AGE IN THE U.S.
The Federal Reserve Board’s Survey of Consumer Finances (SCF), conducted every three years, provides us with the data needed to answer these questions. It helps us understand how wealth is distributed and paints a picture of the net worth of the typical U.S. household.
The Median and Mean Net Worth
In 2022, according to the Federal Reserve, the median net worth in the United States stood at $192,900. This figure includes financial assets (investments, savings, etc.) and personal property (vehicles, residential real estate, etc.). Plus, investment real estate, and equity in private businesses, minus any debt.
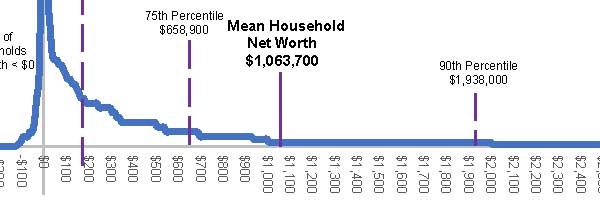
However, the mean wealth of all households, yields a substantially higher figure. When looking at mean net worth, the average is $1,064,000 per family.
This discrepancy between the median and the mean net worth is mainly due to wealth concentration at the top of the distribution. With the top 10% of families boasting an average wealth of nearly $8 million.
Side bar – Mean vs Median Net Worth
The key difference between “median net worth” and “mean net worth” lies in how they measure central tendency in a dataset:
Median Net Worth:
The median net worth is the middle value of a dataset when all household net worths are arranged in ascending order. In other words, it represents the net worth at which half of the households have a higher net worth, and half have a lower net worth.
The median is less sensitive to extreme values or outliers because it is solely determined by the position of the values in the ordered dataset. Extreme values do not significantly impact the median.
Mean Net Worth:
The mean net worth, often referred to as the average, is calculated by summing up the net worth of all households and then dividing the total by the number of households. It’s a measure that considers all values in the dataset and calculates the arithmetic average.
The mean is sensitive to extreme values or outliers because it takes into account the magnitude of all values in the dataset. If there are very high net worth values, they can significantly affect the mean.
In summary, while both the median and mean net worth provide insights into the financial well-being of households. The median represents the middle value in an ordered dataset and is resistant to outliers. While the mean is the average calculated by adding up all values and can be influenced by extreme values.
High and Low Ends of the Wealth Spectrum
At the lower end of the wealth spectrum, families in the bottom 25% of wealth owe more in debt than they have in assets, resulting in an average net worth of -$5,300, signifying a negative net worth. Although this group’s median net worth is slightly positive at $3,500.
This trend of negative net worth in the lowest wealth bracket has persisted since at least the 1989 survey. It has been exacerbated by events like the “great recession” of 2008-2009 and the Covid-19 recession of 2020.
On the higher end of the wealth spectrum, households in the top 10% of wealth have an average (or mean) net worth of $7.8 million. The median value for this jet-setting group comes in at $3.8 million.
The Long-Tail of High-Net-Worth Households
Inequality is even more pronounced in net worth than in income.
Due to the extreme concentration of wealth in the top few percent of households, the average (mean) net worth is equivalent to that of a household in approximately the 80-85th percentile.
In simpler terms, only 15-20% of all households have a net worth greater than the national mean.
Source: Federal Reserve: 2023 Survey of Consumer Finances
Diving deeper, to be in the top 25% of households by wealth, you need a net worth of about $658,900. Which, as stated above, is still below the national average net worth when calculated as the mean.
Even further out the long tail, we come to the 90th percentile. To be considered in the top 10% of all households, one needs to have accumulated a net worth of $1.9 million.
At the very end of our graph above, we reach the 95th percentile of household net worth. To be a member of this group it takes a cool $3.8 million in household net worth.
And although not shown on the graph, you may be wondering about the 98th and 99th percentiles as well. These values are not explicitly called out in the Fed’s Survey of Consumer Finances. But we can make an educated guess.
It is estimated that the 98th percentile cutoff is between $8 and $9 million in total net worth. And the rarified strata of the top 1% (99th percentile) is somewhere north of $13 million.
Why Median Matters
For practical purposes, I believe the median net worth is the more relevant figure when evaluating one’s financial standing. Half of all households have a net worth exceeding $192,900, and the other half falls below this threshold.
Your Future
The Federal Reserve’s Survey of Consumer Finances provides invaluable insights into the net worth of American households.
Understanding the difference between median and mean net worth, as well as how these figures relate to the national average, is essential for evaluating your own financial situation and making informed decisions about wealth accumulation.
The road to financial security is not the same for everyone. Knowledge of these disparities can guide your journey to a more prosperous financial future.