
Employees at technology companies—as a group—are highly compensated. Nonetheless, it may not feel like it, given the high cost of living in tech hubs like Seattle or the San Francisco Bay Area.
To keep grounded in reality, I look forward every three years to the Federal Reserve Board’s Survey of Consumer Finances for the latest household income and net worth trends—a little financial voyeurism.
How do your finances stack up? Are you accumulating assets faster or slower than your peers? How does your income and net worth compare to the rest of the country?
Pure voyeurism aside, studies have found that people save more money toward retirement when they see how much other employees at their company (or in their peer group) are saving—a peer-pressure approach to building a large retirement fund.
Bringing Home The Bacon
The median annual household income in the United States is $52,700. But surprise…income in the United States is not evenly or even normally distributed. The distribution is skewed right, with a long tail of high-income households—resulting in the average (or mean) income being nearly twice the aforementioned median income ($102.7K vs. $52.7K).
This difference can be seen more specifically by comparing the mean vs. median incomes for the different percentile groups. You quickly see that the only group with a material difference is the top decile. The distribution of income conforms fairly closely to a normal distribution (with the mean and median roughly equal) until you reach the top 10% cohort. This is the group where the distribution gets skewed by the long tail of high earners.
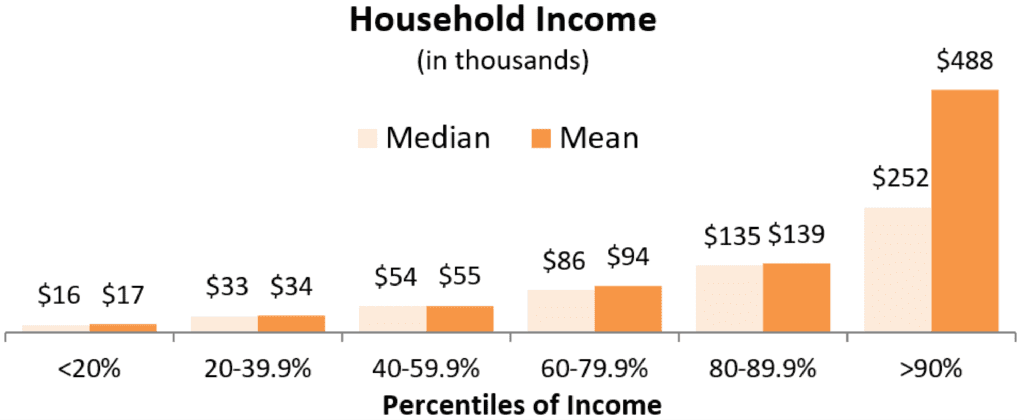
Sources: Federal Reserve, 2016 Survey of Consumer Finances
Taking It To The Bank
According to the Fed, in 2016, the median net worth in the United States was $97,300. This includes financial assets (e.g., investments, savings), personal property (e.g., vehicles, residential real estate), investment real estate, and equity in private businesses.
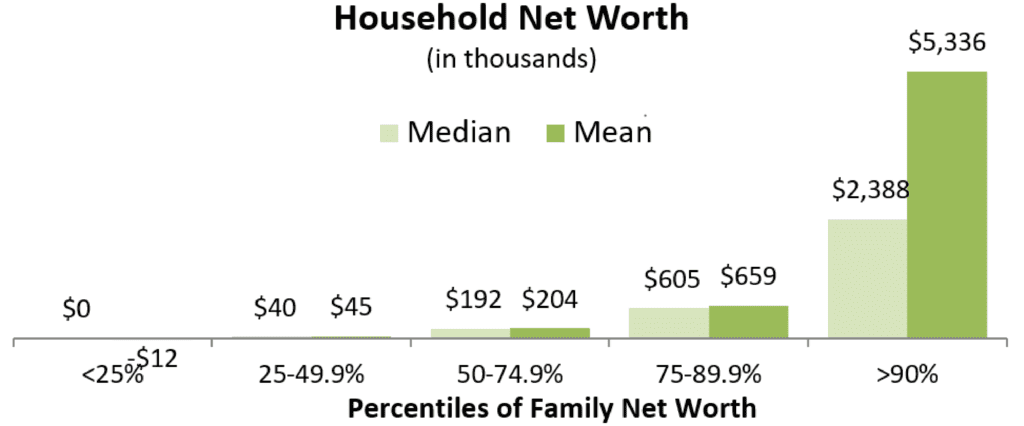
Sources: Federal Reserve, 2016 Survey of Consumer Finances
To a greater degree than income, net worth is tilted to the wealthy. Average household net worth is $692,100, which is greater than the net worth of families in the 75-90% bucket. More specifically—inferring from the chart above—because of the high concentration of wealth at the very top, the average household net worth is approximately equal to that of a household in the 85th percentile.
In other words, only ~15% of all households have a net worth above the national average, sort of the opposite of Lake Wobegon Syndrome—(nearly) everyone is below average.
That being said, I would argue that median net worth is more relevant for comparison purposes—half of all households have more than $97K and half have less.
At the other end of the spectrum, those families in the lowest 25% of households owe more debt than they have in assets—they have a negative average net worth. This has been true at least back to the 1989 survey, although the “great recession” of 2008-2009 pushed this group further into the red.
Growing Your Nest Egg
The financial crisis impacted everyone’s quest to accumulate wealth, not just the bottom 25%. Across the age spectrum, net worth peaked with the 2007 triennial Fed survey and has yet to fully recover nine years later.
The decline is especially jarring, considering that net worth needed to climb about 16% between 2007 and 2016 just to remain flat on an inflation-adjusted basis (i.e., real dollars as opposed to nominal dollars).
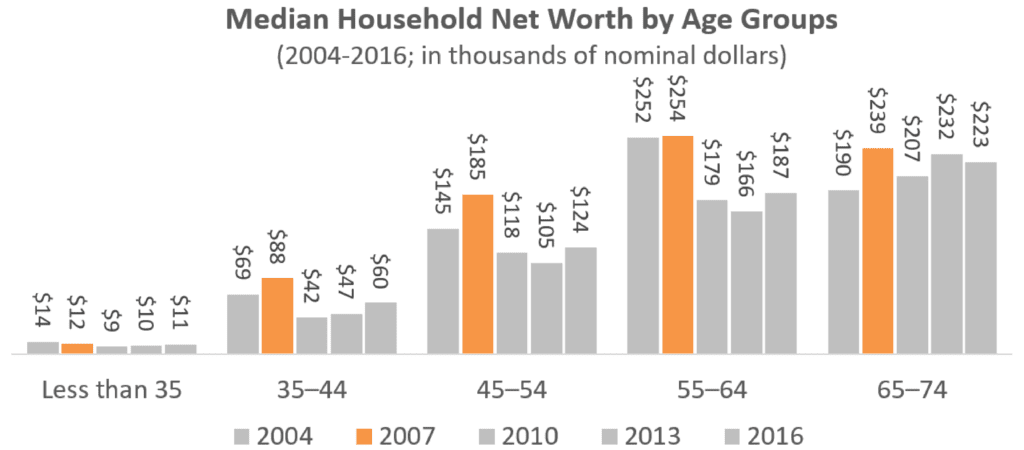
Sources: Federal Reserve, 2016 Survey of Consumer Finances
For one last nugget of information, we look at the value of retirement accounts (IRA, 401(k), pension, etc.) by age cohort. This chart provides a point of comparison on how well you are socking away money for retirement compared to the national average.
But there is an important caveat—this data only captures the 52% of households that actually have a retirement account. If you include households without a single retirement account, it would cut each value roughly in half.
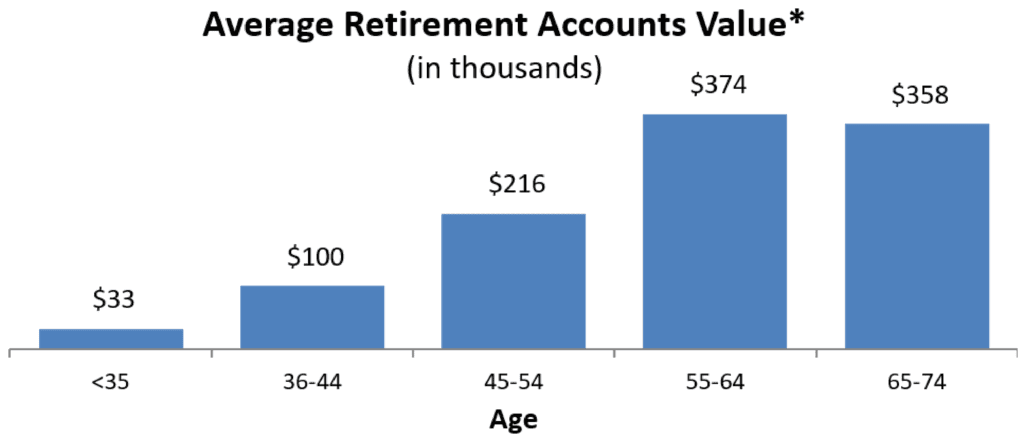
* Includes only households that have at least one retirement account. (Percent with an account varies by age group, but averages 52% overall.)
Sources: Federal Reserve, 2016 Survey of Consumer Finances
Full report on the Fed’s Survey of Consumer Finances