How do your finances stack up? How are doing compared to others? Are you accumulating assets faster or slower than your peers? How does your net worth measure up to the rest of the country?
This is the second posting in a series exploring these questions. (See Part 1 – Income)
Every three years I look forward to the latest Federal Reserve Board’s Survey of Consumer Finances (SCF) to help us answer these questions. And remind us how wealth is distributed and the net worth of a typical U.S. household.
Taking it to the bank
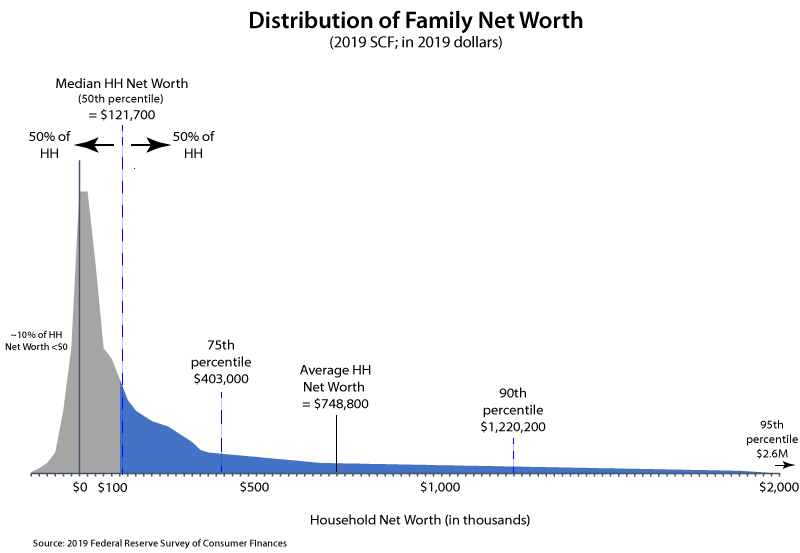
According to the Fed, in 2019, the median net worth in the United States was $121,700. This includes financial assets (investments, savings, etc.), personal property (vehicles, residential real estate, etc.), investment real estate, and equity in private businesses, less any debt.
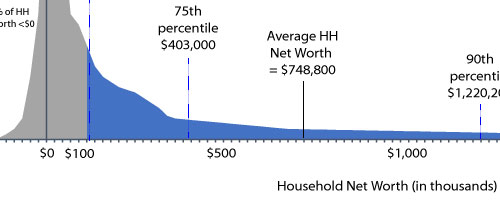
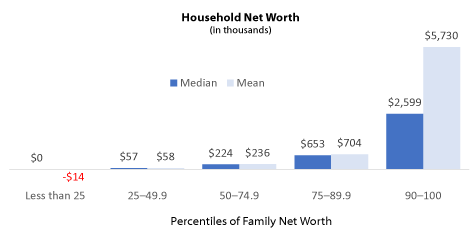
Although the typical family has a net worth of $121,700, the average wealth of all households yields a net worth of $748,800 per family – which is greater than the average net worth of families in the 75-89.9% cohort (see chart below).
Sources: Federal Reserve, 2019 Survey of Consumer Finances.
This divergence between the typical family—or median—and the average net worth—or mean—is largely a function of wealth concentration at the top. With the average wealth of the top 10% of families being nearly $6 million.
At the low-end of the wealth spectrum, families in the bottom 25% of wealth actually owe more in debt than they have in assets; with an average net-worth of -$13,500 (i.e., more debt than assets).
This situation of negative net worth has been true at least back to the 1989 survey, although the “great recession” of 2008-2009 further pushed this group into the red (and the Covid-19 recession of 2020 likely made the situation even worse).
The Long-Tail of High-Net-Worth Households
Overall, to an even greater degree than income, net worth is significantly tilted to the wealthy.
More specifically, due to the wealth of the top few percent of households, the average net worth is approximately equal to that of a household in the 80-85th percentile.
In other words, only ~15-20% of all households have a net worth above the national average (total wealth divided by number of households).
I would argue that median net worth is the more relevant figure when think about your own station – half of all households have greater than $121,700 in wealth and half have less.
Growing your nest egg
The 2008-2009 financial crisis impacted everyone’s quest to accumulate wealth, not just the bottom 25%.
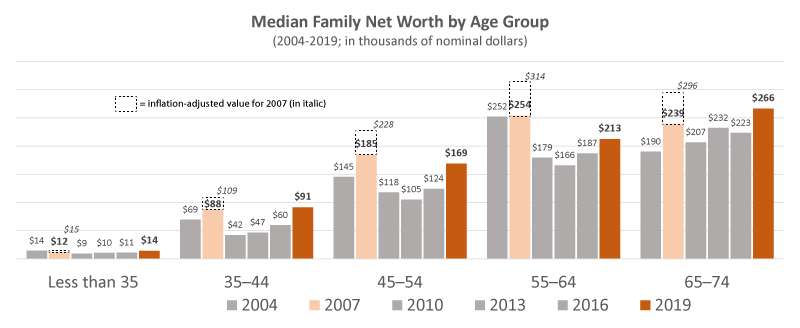
Across the age spectrum, net worth peaked for middle-age households with the 2007 tri-annual Fed survey and has yet to fully recover twelve years later. Although it has for those over 65 or younger than 45 years old.
The decline is especially jarring consider your net worth needed to climb about 23% between 2007 and 2019 just to remain flat on an inflation-adjusted basis (i.e., real dollars as opposed to nominal dollars).
Sources: Federal Reserve, 2019 Survey of Consumer Finances.
The chart above shows median family net worth by age cohorts in nominal dollars (i.e., not adjusted for inflation). If you adjust the 2007 values for inflation (as shown by the dashed box and values in italic), across the spectrum a typical family within each age cohort had more wealth 12 years prior than in 2019.
Clearly the impact of the great financial crisis was deep and persistent for many families.
Full report on the Fed’s Survey of Consumer Finances
2 Comments
[…] For more details on the distribution of wealth in the United States, see FINANCIAL RUBBERNECKING – PART 2: NET WORTH. […]
Reply[…] This is the third posting in a series exploring these types of questions. (See Part 1 – Income; See Part 2- Net Worth) […]
Reply