
Tech employees – as a group – are highly-compensated.
However, it may not feel that way given the high cost-of-living in many tech hubs like Seattle and the San Francisco Bay Area.
To keep grounded, every three years I look forward to the latest Federal Reserve Board’s Survey of Consumer Finances (SCF) to remind us of typical household incomes in the United States.
Plus, I think most of us enjoy a little financial voyeurism.
How do your finances stack up? How are doing compared to others? Are you accumulating assets faster or slower than your peers? How does your income measure up to the rest of the country?
This is the first posting in a series exploring these questions based on the SCF.
Bring home the bacon
The median annual household income[i] in the United States was $58,600 in the 2019 SCF.
But hold on to your hat, you should not be surprised to hear household income in the United States is not evenly or even normally distributed.
The income distribution is ‘skewed’ with a long tail of high-income households – resulting in an average (or mean) income of $106,500, nearly twice the median income.
Comparing the mean vs. median incomes for the percentiles groups highlights this skew. In the chart below, you see the only cohort with a material difference is the top decile.
The distribution of income conforms close to a normal distribution (with the mean and median roughly equal) until you reach the top percentile band (>90%). This is the group with the average income skewed by a long tail of high earning households.
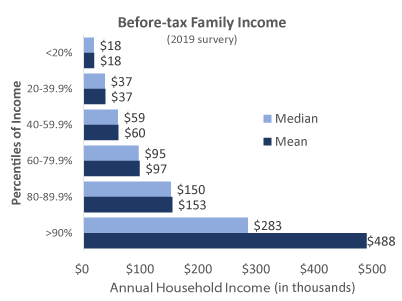
Sources: Federal Reserve, 2019 Survey of Consumer Finances. Full report on the Fed’s Survey of Consumer Finances
The top 5%
Over the past decade there has been a lot of attention paid to the top 1% of earners.
The Fed survey does not provide this level of detail but does tell us the cut-off (or minimum required) to be considered in the top 5% of family income. The median—or mid-point—of the >90% bracket (i.e., the top 90-100% of family income) is what a family at the 95% percentile earns.
In other words, 5% of all households in the United States earned more than $283,000 based on the 2019 SCF.
The top 1%
Searching other sources, one gets a variety of answers on the income required to be considered in the top 1%.
Each article uses a different methodology (e.g., AGI from tax returns vs. total income) and data sources which may only include a subset of the total population (e.g., Federal taxpayers vs. all households).
Hence, these values are not necessarily directly comparable to each other or to the figures published by the Federal Reserve.
That being said, here are a few estimates of what it takes to be in the Top 1% of Earners:
» Economic Policy Institute (EPI) in December 2019 (based on 2018 income) = $737,697 annual income [ii]
» 24/7 Wall Street (based on IRS’s Statistics of Income) = $421,347 [iii]
» Bloomberg (based in IRS data for 2017) = $515,371 [iv]
[i] Figures in 2019 dollars and based on the 2019 Federal Reserve Survey of Consumer Finances
[ii] https://www.investopedia.com/personal-finance/how-much-income-puts-you-top-1-5-10/
[iii] https://www.usatoday.com/story/money/2019/06/03/how-much-you-need-to-make-to-be-in-the-1-in-every-state/39529571/
[iv] https://www.bloomberg.com/news/articles/2019-10-16/americans-now-need-at-least-500-000-a-year-to-enter-the-top-1
2 Comments
[…] is the third posting in a series exploring these types of questions. (See Part 1 – Income; See Part 2- Net […]
Reply[…] This is the second posting in a series exploring these questions. (See Part 1 – Income) […]
Reply